This blog was co-authored with Marius Panga, and x-posted on https://community.databricks.com/t5/technical-blog/how-to-integrate-databricks-and-power-bi-for-real-time-streaming/ba-p/54670
In recent years, a tidal wave of real-time data has inundated us from individuals, machines, and organizations across various channels—operational systems, online interactions, cloud-based data services, and the expansive realm of IoT. This ubiquitous real-time data surge offers unprecedented opportunities, enabling the development of applications for fraud detection, personalized customer offers, dynamic real-time pricing adjustments, predictive maintenance for machines, and much more. Given this accelerated pace, the critical question emerges: How can we empower decision-makers with the timely data essential for making informed choices in the moment?
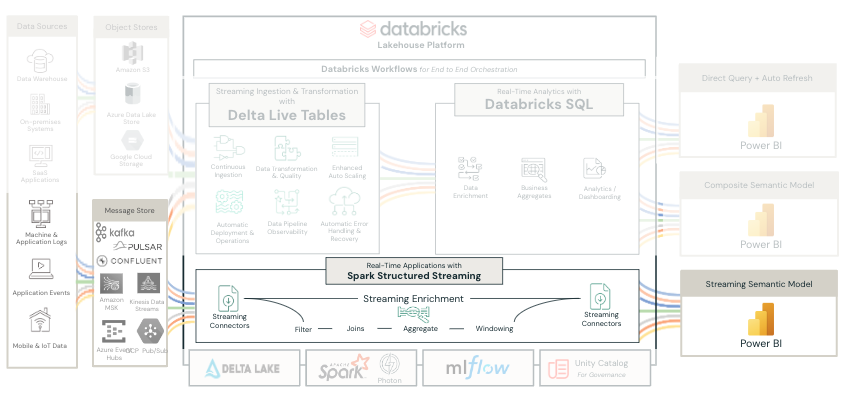
Databricks Lakehouse is a great platform for streaming, with powerful capabilities such as Delta Live Tables (DLT) and Structured Streaming. Power BI, being the leading visualization tool in the market for years, has features to visualize streaming data that are not widely known. In this blog post, we will outline three different scenarios in which you can integrate Databricks and Power BI to process and visualize streaming data.
- Delta Live Tables + Power BI Direct Query and Auto Refresh
- Delta Live Tables + Power BI Composite Model
- Structured Streaming + Power BI streaming semantic models
The code that can be used to produce demos for these scenarios can be found in a GitHub repo here. You can also find a Data & AI Summit talk walking through the demos in the scenarios here.
Scenario 1: Delta Live Tables + Power BI Direct Query and Auto Refresh
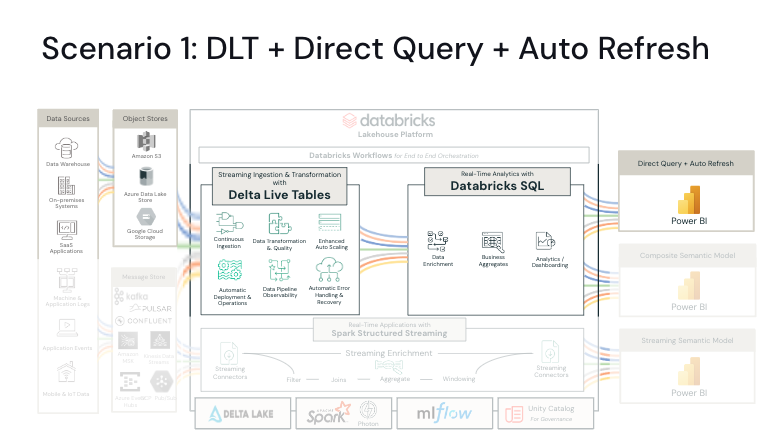
Scenario 1 uses Delta Live Tables to process the streaming data and sink it into the gold layer. Power BI then queries those tables using a Databricks SQL warehouse via Direct Query Mode. With automatic page refresh turned on in Power BI, you can refresh the Power BI visualizations at nearly the same speed that your real-time data is being processed.
Delta Live Tables
Delta Live Tables (DLT) is an ETL capability within Databricks that allows you to write declarative pipelines using SQL or Python. It can also enforce data quality by defining expectations within the data pipelines. DLT unifies streaming and batch data loads, making it easy to switch between them.
SQL Warehouses
A Databricks SQL Warehouse is a compute resource that lets you run SQL commands on top of your data residing in cloud storage. It is optimized for low latency and high concurrency workloads and is the recommended way to connect Power BI to your Databricks Lakehouse. Within Databricks UI, Databricks SQL offers an intuitive environment for data analysts to write SQL statements. The SQL warehouses are available as Serverless or non-serverless (Classic and Pro SKUs) and support a rich ecosystem of tools like Power BI.
The last mile of this architecture is a Power BI DirectQuery semantic model. Typically, a Power BI report on a DirectQuery semantic model gets refreshed when someone interacts with a visual or explicitly refreshes the report via the refresh visuals button. Alternatively, you can turn on automatic page refresh in Power BI Desktop settings and the report will refresh at the frequency that you set without any additional steps or interactions required. The refresh rate can be set as low as 1 second in Power BI Desktop. However, you would normally want to set that interval to match the expected new data arrival rate.
Power BI Premium capacity admins can set a minimum auto-page refresh rate in the Premium capacity setting UI to prevent different auto refresh semantic models consuming too much compute. When a semantic model is published to Power BI service, the actual refresh rate of the visual is the less frequent of what the author had set in Power BI Desktop and the minimum auto-page refresh rate in the Premium capacity setting.
It is worth mentioning that auto-page refresh is typically used on workspaces with Power BI Premium capacity. This is because the Pro capacity has a minimum of 30 minutes for page refresh, which is not ideal for real-time analytics.
| Capacity | Power BI Pro | Power BI Premium |
| Minimum Refresh Frequency | 30 minutes | 1 second |
Scenario 2: Delta Live Tables + Power BI Composite Model

Scenario 2 is similar to scenario 1, with the same components: Delta Live Table and a Databricks SQL warehouse. The difference is that scenario 2 uses a Composite Model instead of a Direct Query semantic model.
The advantage of the Composite Model over Direct Query semantic model is that a subset of the tables are cached (having either Import or Dual as the storage mode). This means, depending on the situation, Power BI will either query the cached tables in memory or send down SQL queries to the Databricks SQL warehouse. For more information on Composite Models, please see Power BI documentation.
Scenario 3: Structured Streaming + Power BI streaming semantic models
Unlike Scenario 1 and 2, Scenario 3 uses Structured Streaming for processing real-time data. While Delta Live Tables offer a white-glove approach to pipelines, for Structured Streaming pipelines, you will need to manage your own checkpoints and infrastructure. On the other hand, Structured Streaming offers more control and flexibility over a managed solution like Delta Live Tables. With Structured Streaming, you have the choice to persist delta tables or not. Not persisting delta tables will result in lower latency, but it also means streaming data can not be analyzed for later use. Alternatively, persisting delta tables will enable data storage for future analysis, but it may introduce some latency.
In scenario 3 we are not using a semantic model authored in Power BI Desktop, but instead we are using streaming semantic models in the Power BI Service. You will write a UDF and use foreachBatch() to push data from the Structured Streaming pipeline to the Power BI streaming semantic model using the Push API. Streaming semantic models are only limited to a single table and retain history for a very limited time period. Once the time period expires, data is ejected from the Power BI memory and cannot be recovered. Streaming semantic models are a Power BI service only feature and do not allow users to perform any transformations inside Power BI service. In addition, there are only basic visualizations available in Power BI service if you are using streaming semantic models.
If you want to analyze the streaming data in the future, you can implement a variation of scenario 3, which would persist gold tables as part of the Structured Streaming pipelines, and then use a SQL warehouse and Direct Query / Composite Model with auto-page refresh to query the gold tables that are written by the Structured Streaming pipelines.
Considerations
In any kind of Direct Query/Composite Model scenario, you want to consider performance tuning best practices, such as reducing the number of visuals on a page, enabling referential integrity and pushing down transformation logic to Databricks. For more tips and tricks for performance tuning for Power BI on Databricks, please see Power Up your BI with Power BI and Lakehouse in Azure Databricks.
On the Databricks side, it is recommended to use SQL warehouse for Power BI direct query / composite models instead of interactive (all-purpose) clusters. SQL warehouse is optimized for business intelligence workloads with features such as Predictive IO and Intelligent Workload Management.
In addition, choosing the appropriate SQL Warehouse SKU is important. As streaming is 24/7, a Classic SQL warehouse will be more suitable than a Serverless SQL warehouse. If you are more performance conscious, choose the Pro tier. If you are more cost conscious, go with the classic SKU. For lower latency requirements, consider using Photon acceleration in Delta Live Tables and Structured Streaming Pipelines.
Conclusions
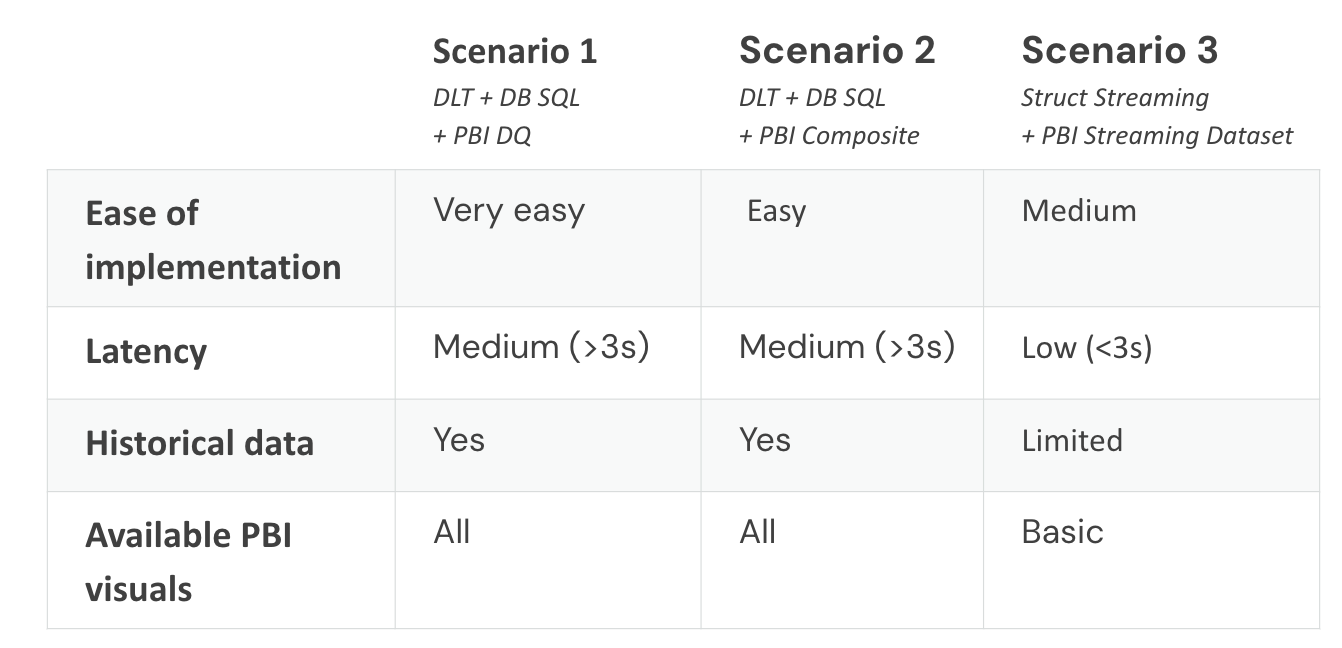
The below table summarizes the three scenarios that are described in this blog post. You can also find a Data & AI Summit talk on this topic, which is available on record here. The code that is used to produce demos that are shown in the talk can be found here.