This blog was co-authored with Marius Panga, and x-posted on https://community.databricks.com/t5/technical-blog/databricks-cost-analysis-and-cross-charge-with-power-bi/ba-p/59820
Introduction
Effective cost management is a critical consideration for any cloud data platform. Historically, achieving cost control and implementing cross-charge mechanisms in Databricks has been challenging. In the past, organizations often needed to deploy solutions such as Overwatch (a Databricks Labs project) to establish comprehensive visibility into their expenditures on the Databricks platform. With the recent release of system tables, Databricks has made it much easier to track usage and spending across your Databricks deployments.
Whilst you can build custom reports off system tables, this in itself can be time consuming. Thankfully, we have created a Power BI template, which you can easily put on top of your own system tables, providing you with an easy and convenient tool to analyze and manage your Databricks costs and usage and even institute chargeback models.
With this template approach, the setup effort is minimized. The Power BI template (.PBIT file) can be downloaded from GitHub; all you need is to have system tables enabled, and a Databricks SQL Warehouse (connection string to be used as parameters in Power BI template) to start analyzing your own spending and cross-charging.
This blog and template provides you with an example of how analytics can be done using system tables. If you are using other visualization tools, such as Tableau, Looker or native Databricks dashboards, you can draw inspiration from this template and build your own custom analytics solution on top of system tables.
The resulting report can help you answer example questions like:
- How much did we spend on Databricks broken down by day / week / month / quarter?
- How much are we spending for each Databricks service type (SQL, Jobs, and more!)
- How much cost are the different cost centers / business units / environments generating?
- What are the key drivers of my Databricks spending?
Report Overview
The report consists of three tabs that can be used out of the box, or customized to fit specific business needs.
Cost Overview
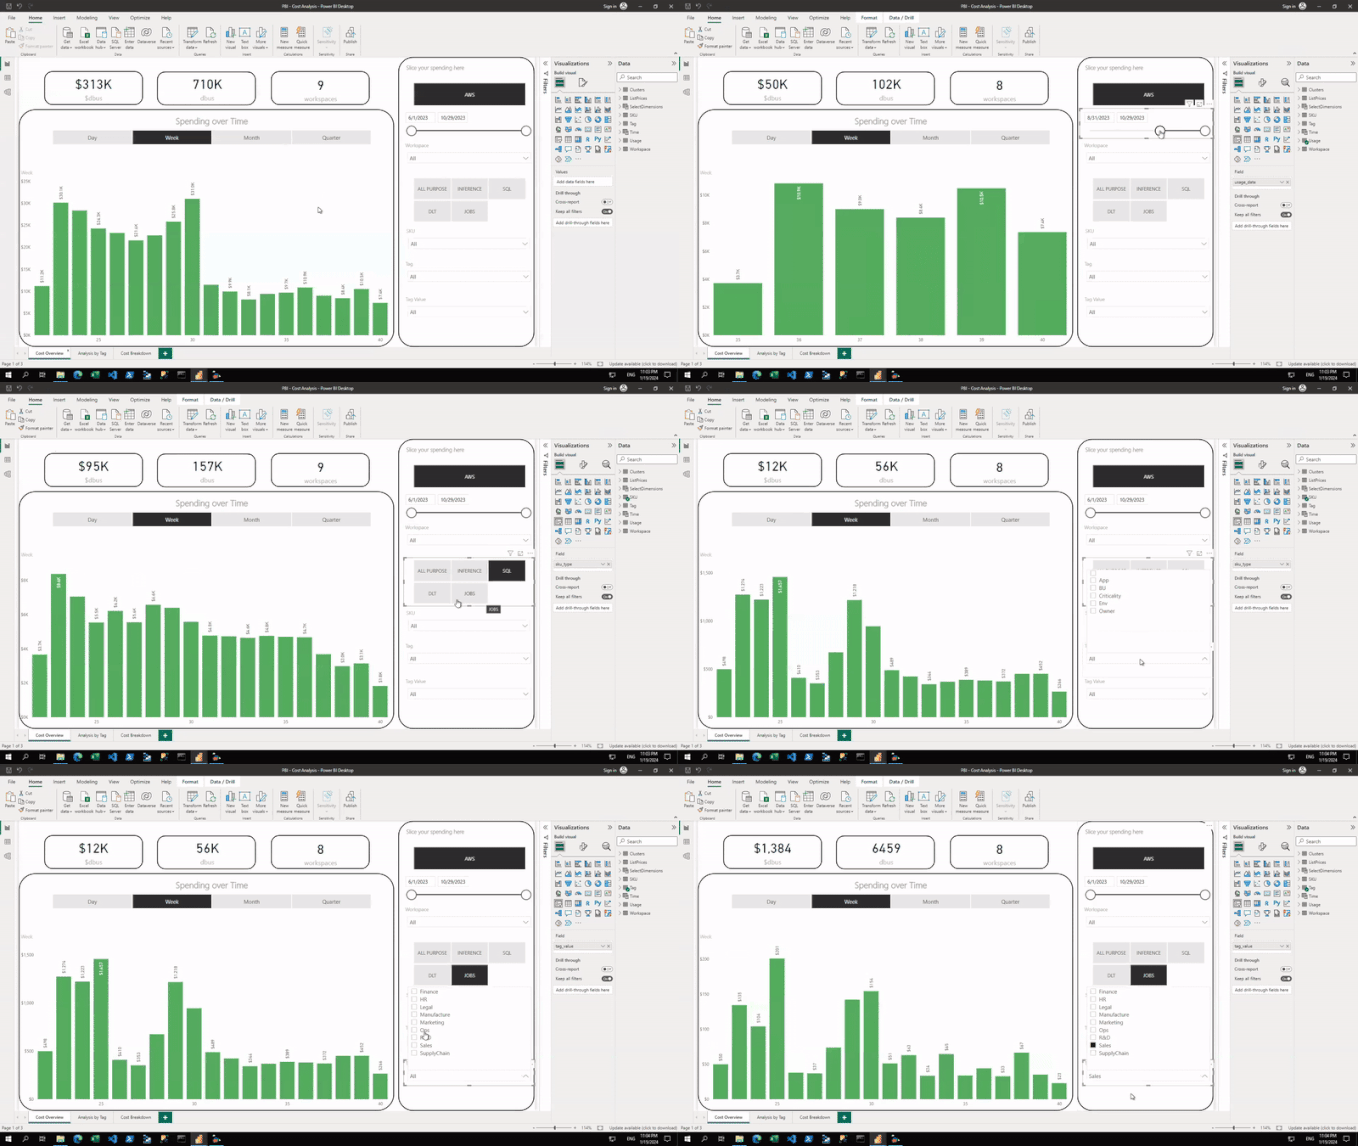
The Cost Overview tab provides a high-level overview of the Databricks spend by various time intervals, as well as high-level KPIs. The user can then use the rich filter pane to interactively slice the spending.
Analysis by Tag
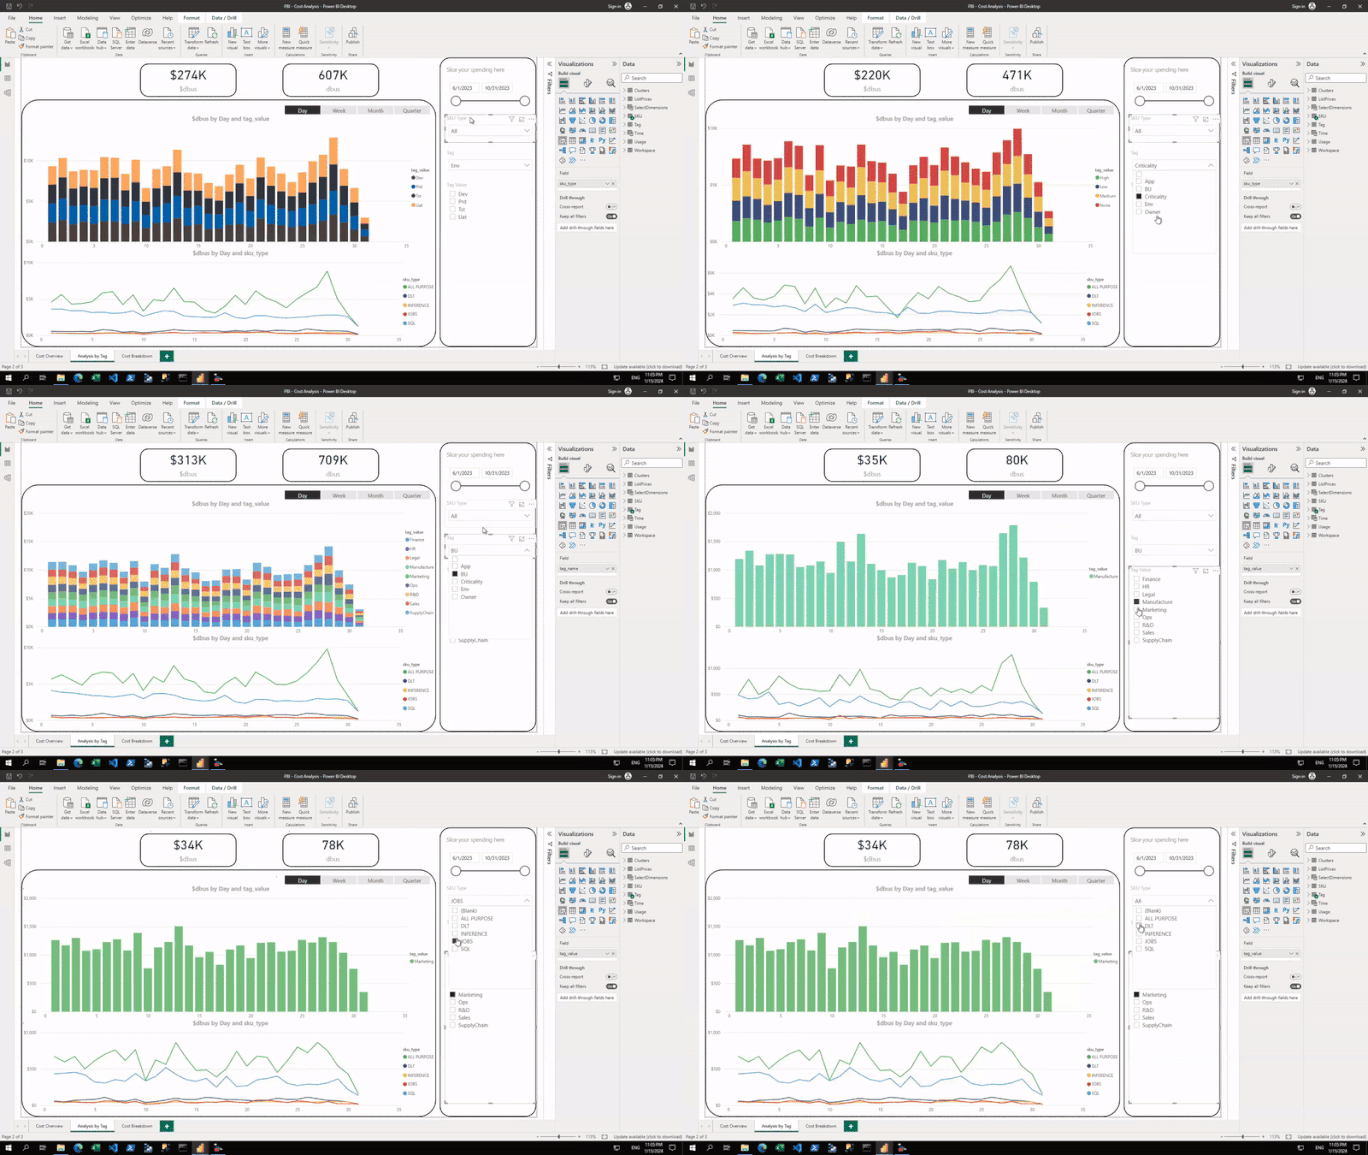
This tab goes into more detail and its main purpose is to facilitate the analysis of spend by the various cluster tags defined by the business. Tags can be a very powerful tool to slice spend by groupings that make sense to the business. One example is implementing an internal cross-charging strategy by defining a cost center or business unit tag and slicing the Databricks spend by it.
Cost Breakdown
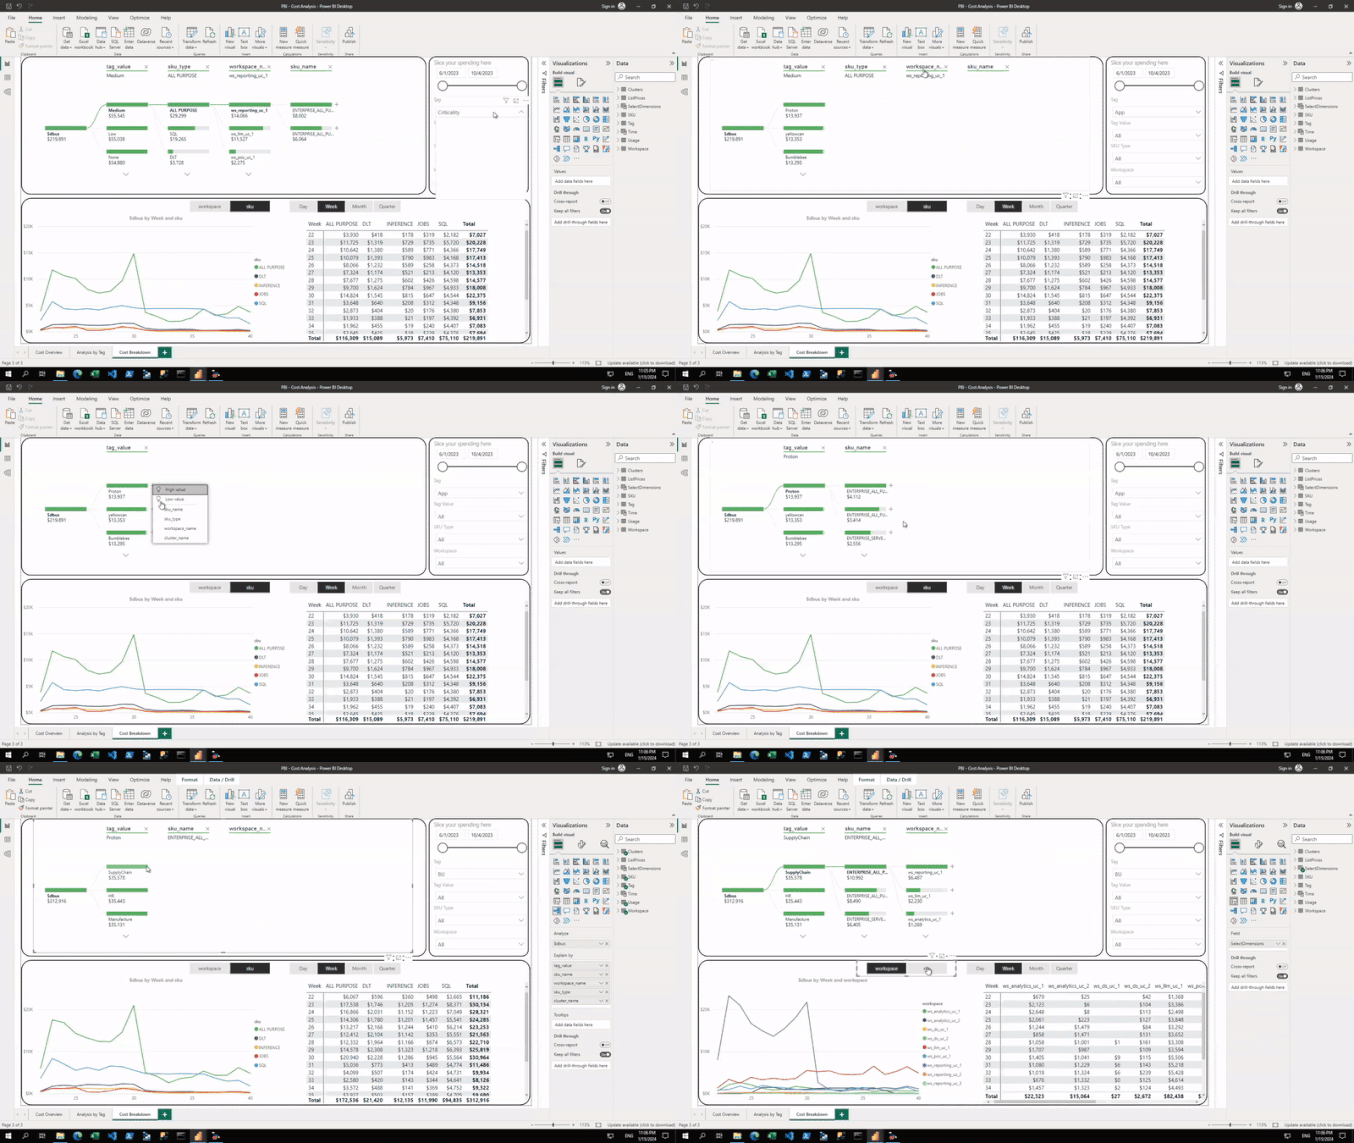
The last tab is intended to allow users to further understand their cost profile across their environment and identify the main activities or resources driving that cost. It uses the decomposition tree visual, which is a powerful tool that allows people to visualize data across multiple dimensions.
Main solution components
System tables hold the operational data of your Databricks account under the special “system” catalog in Unity Catalog (UC). This catalog resides in the Databricks-hosted store and is made available to you securely via Delta Sharing. System tables support a wide range of observability capabilities and include tables holding data pertaining to billing, lineage, usage, auditing, and predictive optimizations. In this article, we will use the billable usage table and pricing table. Just like with other tables secured by Unity Catalog, you will need to make sure you have read permissions on the relevant system tables (mentioned below) in order to be able to successfully run this Power BI report.
A Databricks SQL Warehouse is a compute resource that lets you run SQL commands on top of your data residing in cloud storage. It is optimized for low latency and high concurrency workloads and is the recommended way to connect Power BI to your Databricks Lakehouse. With its intuitive UI, data analysts can easily write SQL statements against Serverless or Managed (Classic and Pro) Databricks SQL Warehouses.
Power BI Templates are intended to save Power BI connection details, semantic models, report designs, layouts, visuals and other elements for reuse. For example, you can save a report template with pre-designed data source connections, data transformation & modeling rules, visuals, themes, and formatting settings so that you can apply them to new reports in the future, saving time and ensuring consistency in your reports. Templates don’t contain any actual data, so are a good way to share this logic.
How to use the Power BI template
- Download the .PBIT file from the GitHub repository here.
- Make sure you have the latest version of Power BI Desktop installed on your computer. Double click on the .PBIT file you’ve just downloaded, and you will be prompted to fill in the parameters related to connecting to the Databricks SQL warehouse instance.
Note: You can use an existing warehouse for this, or provision a new one. If creating a new one dedicated for this analysis, we recommend using the XS size due to the low data volumes and logic complexity.
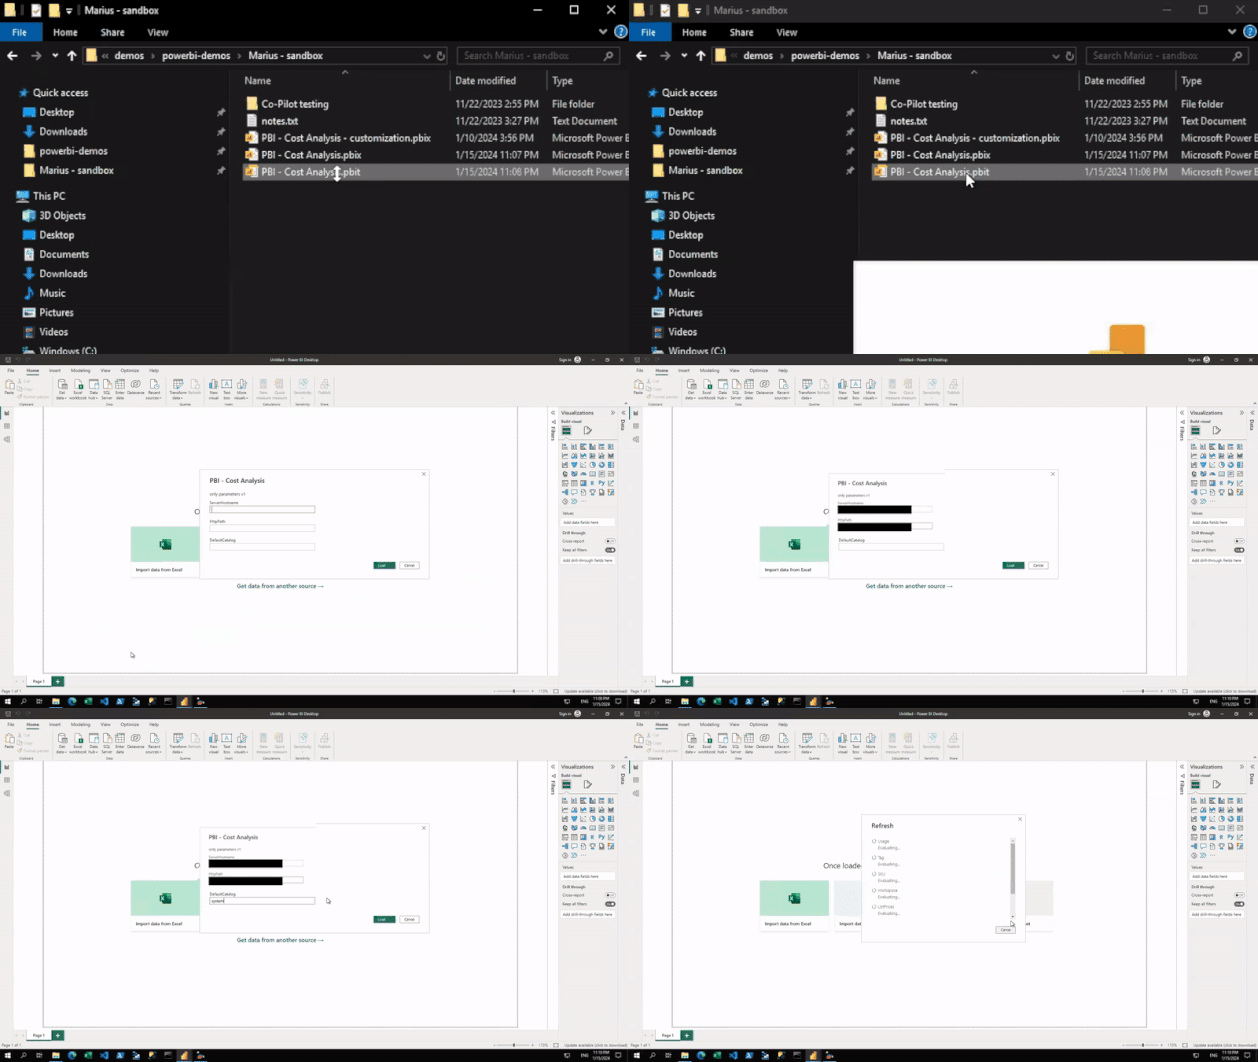
3. Fill in the parameters as described below:
- ServerHostname – the server hostname of the Databricks SQL Warehouse you wish to use to execute the Power BI report. Details on how to get to it are found under compute settings in either the ODBC or JDBC driver documentation.
- HttpPath – the HTTP path value of the Databricks SQL Warehouse you wish to use to power the Power BI report. Details on how to get to it can also be found under compute settings.
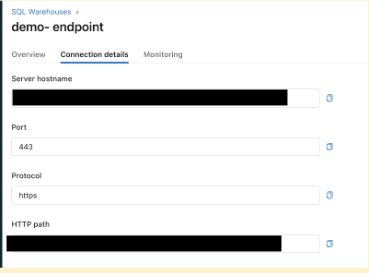
- DefaultCatalog – the Databricks catalog where the system tables will reside. By default this will use the prebuilt “system” catalog, but can be overwritten if you wish to use your own custom system tables.
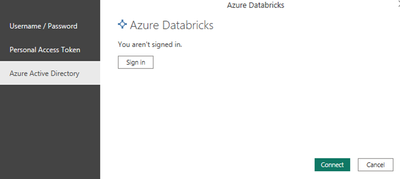
4. Once the parameters are correctly filled into the Power BI template, you will be prompted to authenticate to Databricks either by using a PAT token or Azure Active Directory.
5. Since this Power BI report is using an import mode semantic model (previously known as a dataset), the tables in the semantic model will now refresh and the report should be ready to use.
Semantic model overview
This section includes more details about the tables included in the report’s semantic model, the relationships between them and the source for each. You can get more details by inspecting the model in the actual report.
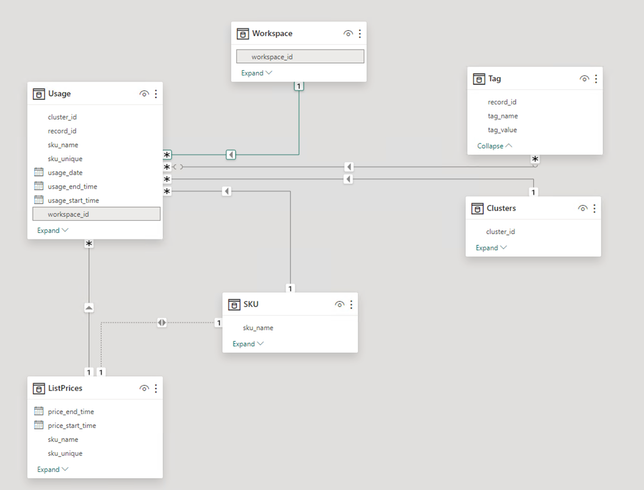
Main data mart
| Table name | Description |
| Usage | Built from the Usage system table |
| Workspace | Manually entered mapping between the workspaceId and workspaceName |
| Tag | Extracted from the Usage system table |
| Clusters | Extracted from the Usage system table |
| SKU | Extracted from the Usage system table |
| ListPrices | Built from the Pricing system table |
| Time | Date dimension, automatically populated |
| SelectDimensions | Helper table for report navigation, automatically populated |
The workspace name is currently not available in the system tables. To make the report more accessible, we’ve added this information as a manual step for the end-user to provide. As the system tables evolve to include this missing data, we will be updating the template to retire these few manual steps.
To populate these tables and change the default values, you need to:
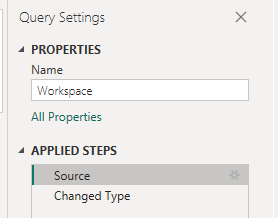
- Select the Transform data option in Power BI

2. Select the relevant table (Workspace) from the Queries section
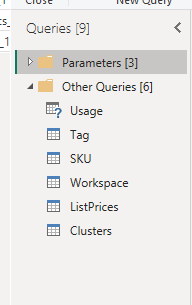
3. With the Workspace table selected, in the Query Settings menu on the left, under Applied Steps, edit the Source step
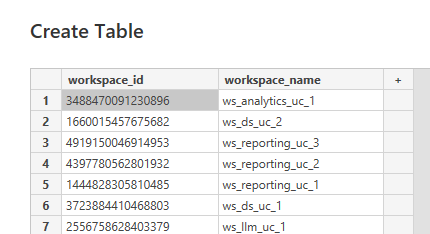
4. In the following Create Table screen, replace the default values with the ones that are relevant for your organization.
How to make the most out of this template
System tables reflect the spending at the compute cluster level. Setting up standard tags for compute clusters through compute policies according to your organizational needs is a pivotal part of the successful implementation of this template. The tags used in the compute clusters will show up in the custom_tags field of the usage table. The example in this blog is set up with tags outlined in below table tags: BU, owner, criticality, env, app. We recommend designing custom policies and setting up mandated tags that can help with better drill-down and cross-charging.
| Tag | Description | Example Values |
| BU | Business Unit that provisioned this cluster | Marketing, Ops, SupplyChain, Sales, HR, Finance, R&D |
| Owner | The Owner of the cluster | Susan, Mike, Sara, Maria, John, Ray |
| Criticality | How critical is this cluster | High, Medium, Low |
| Env | The environment this cluster is part of | Dev, Test, Uat, Prd |
| App | The application this cluster is used for | blackwall, yellowcan, tuna, columbus, pinktiger |
Customization Tips
Multi-tag Root Cause Analysis
The current data structure in the semantic model will allow for root cause analysis on a single tag name. You can switch between different tag names for the decomposition tree analysis.
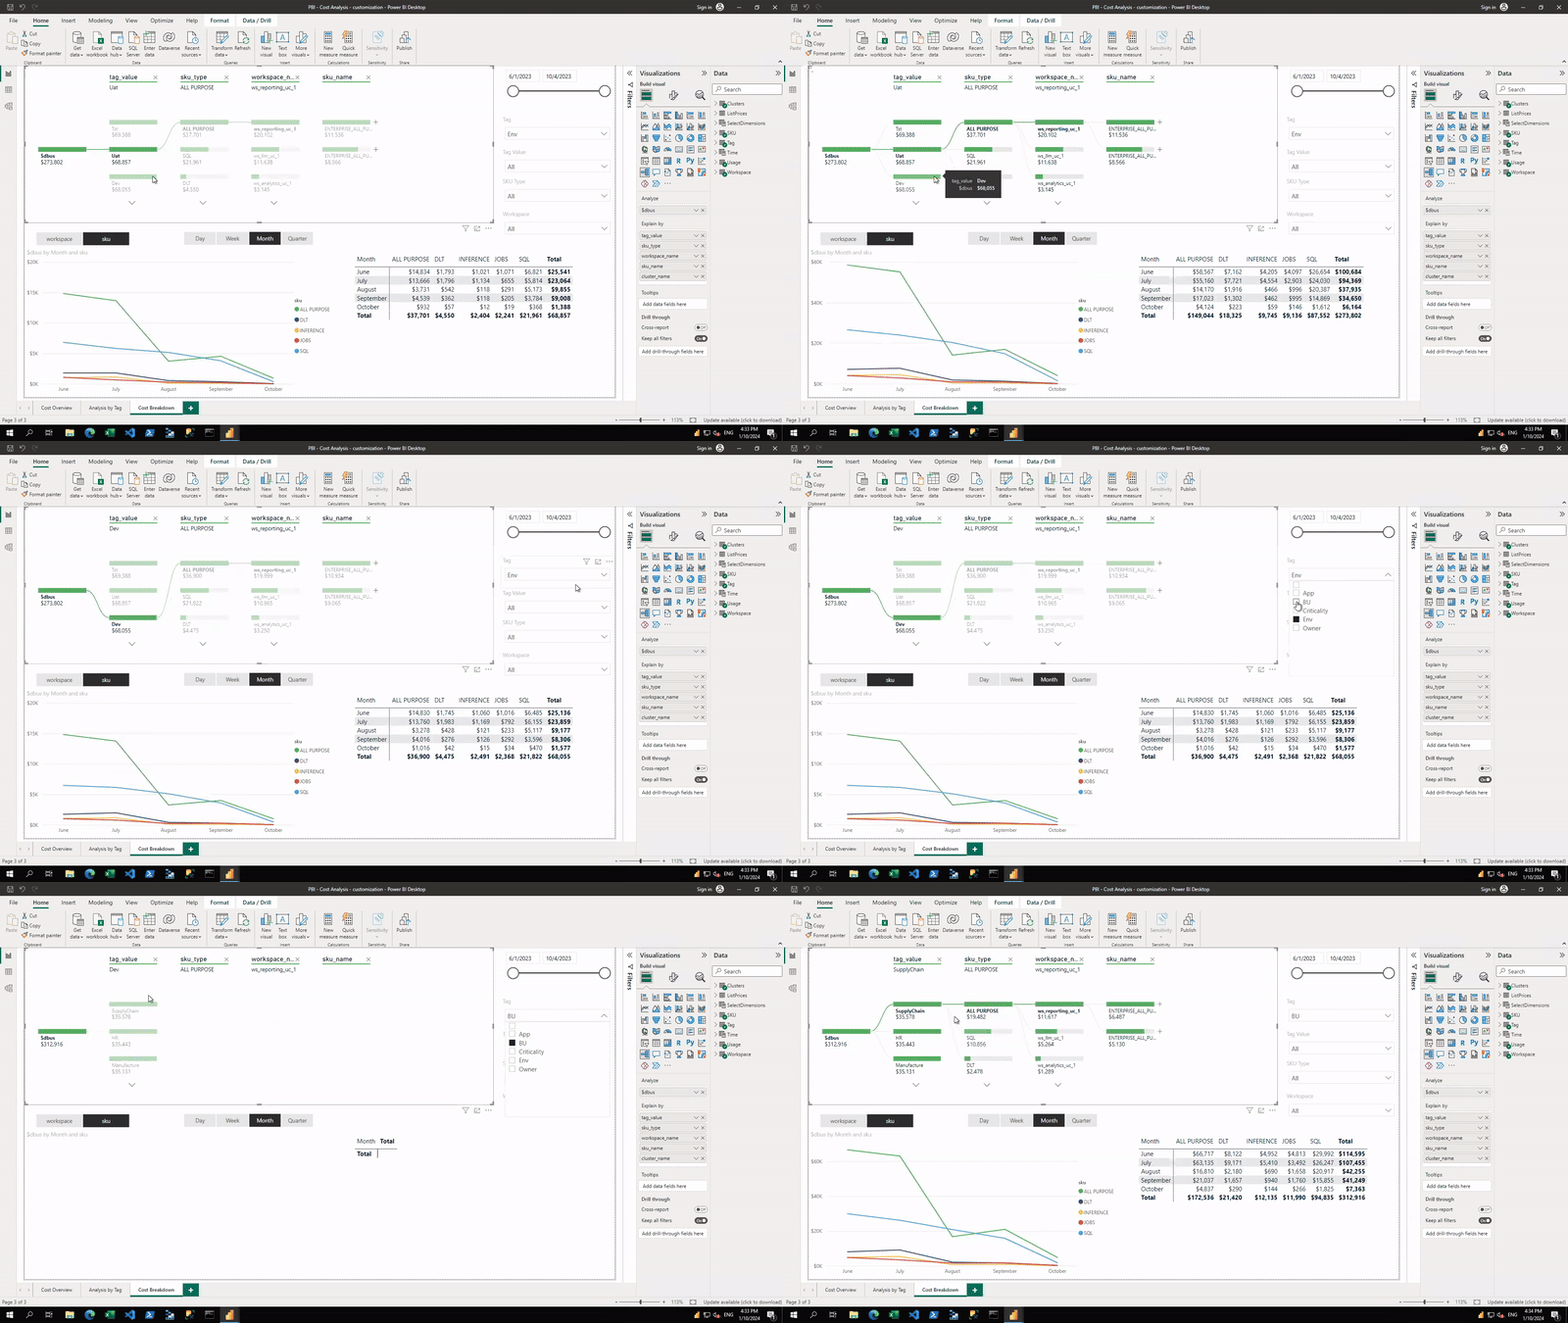
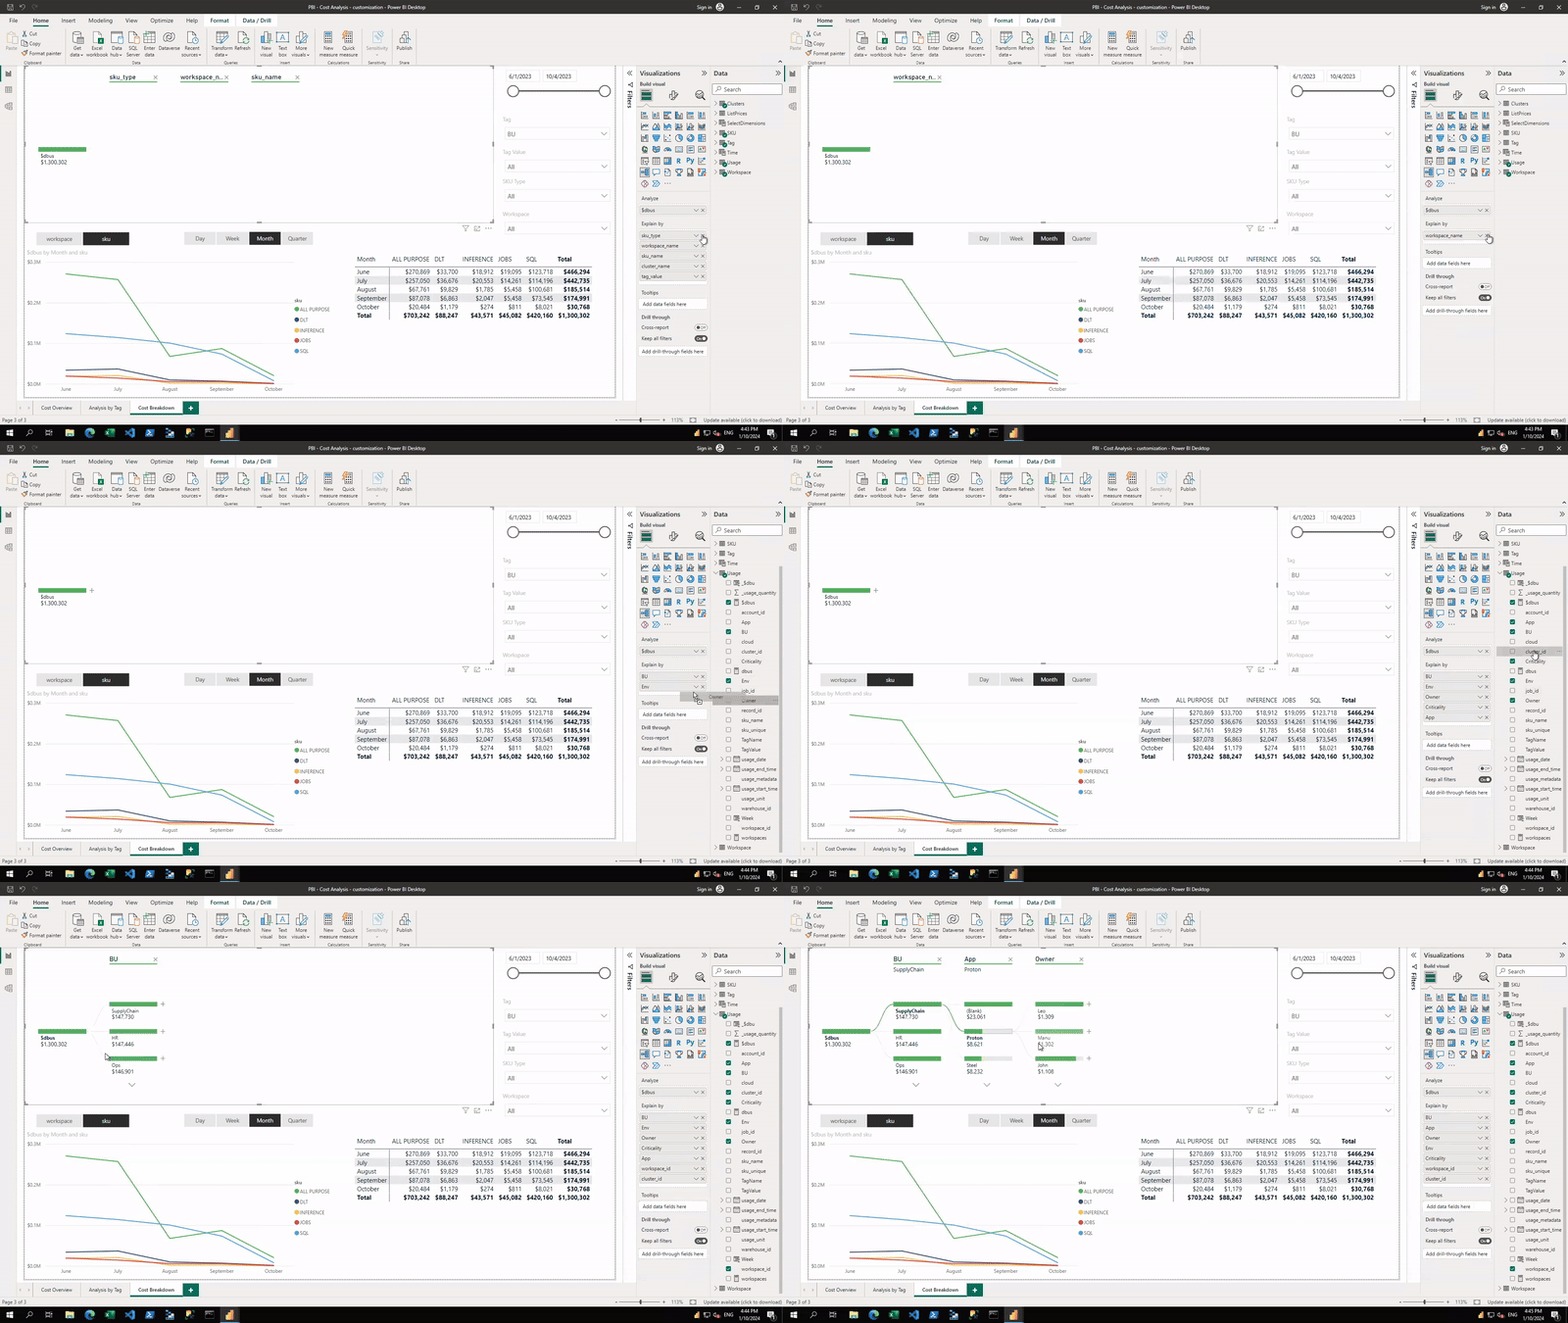
If you would like to perform root cause analysis on multiple tags simultaneously using the decomposition tree visual, the usage table needs to be pivoted such that each tag name is its own column. See below on how to pivot the usage table in the power query editor.
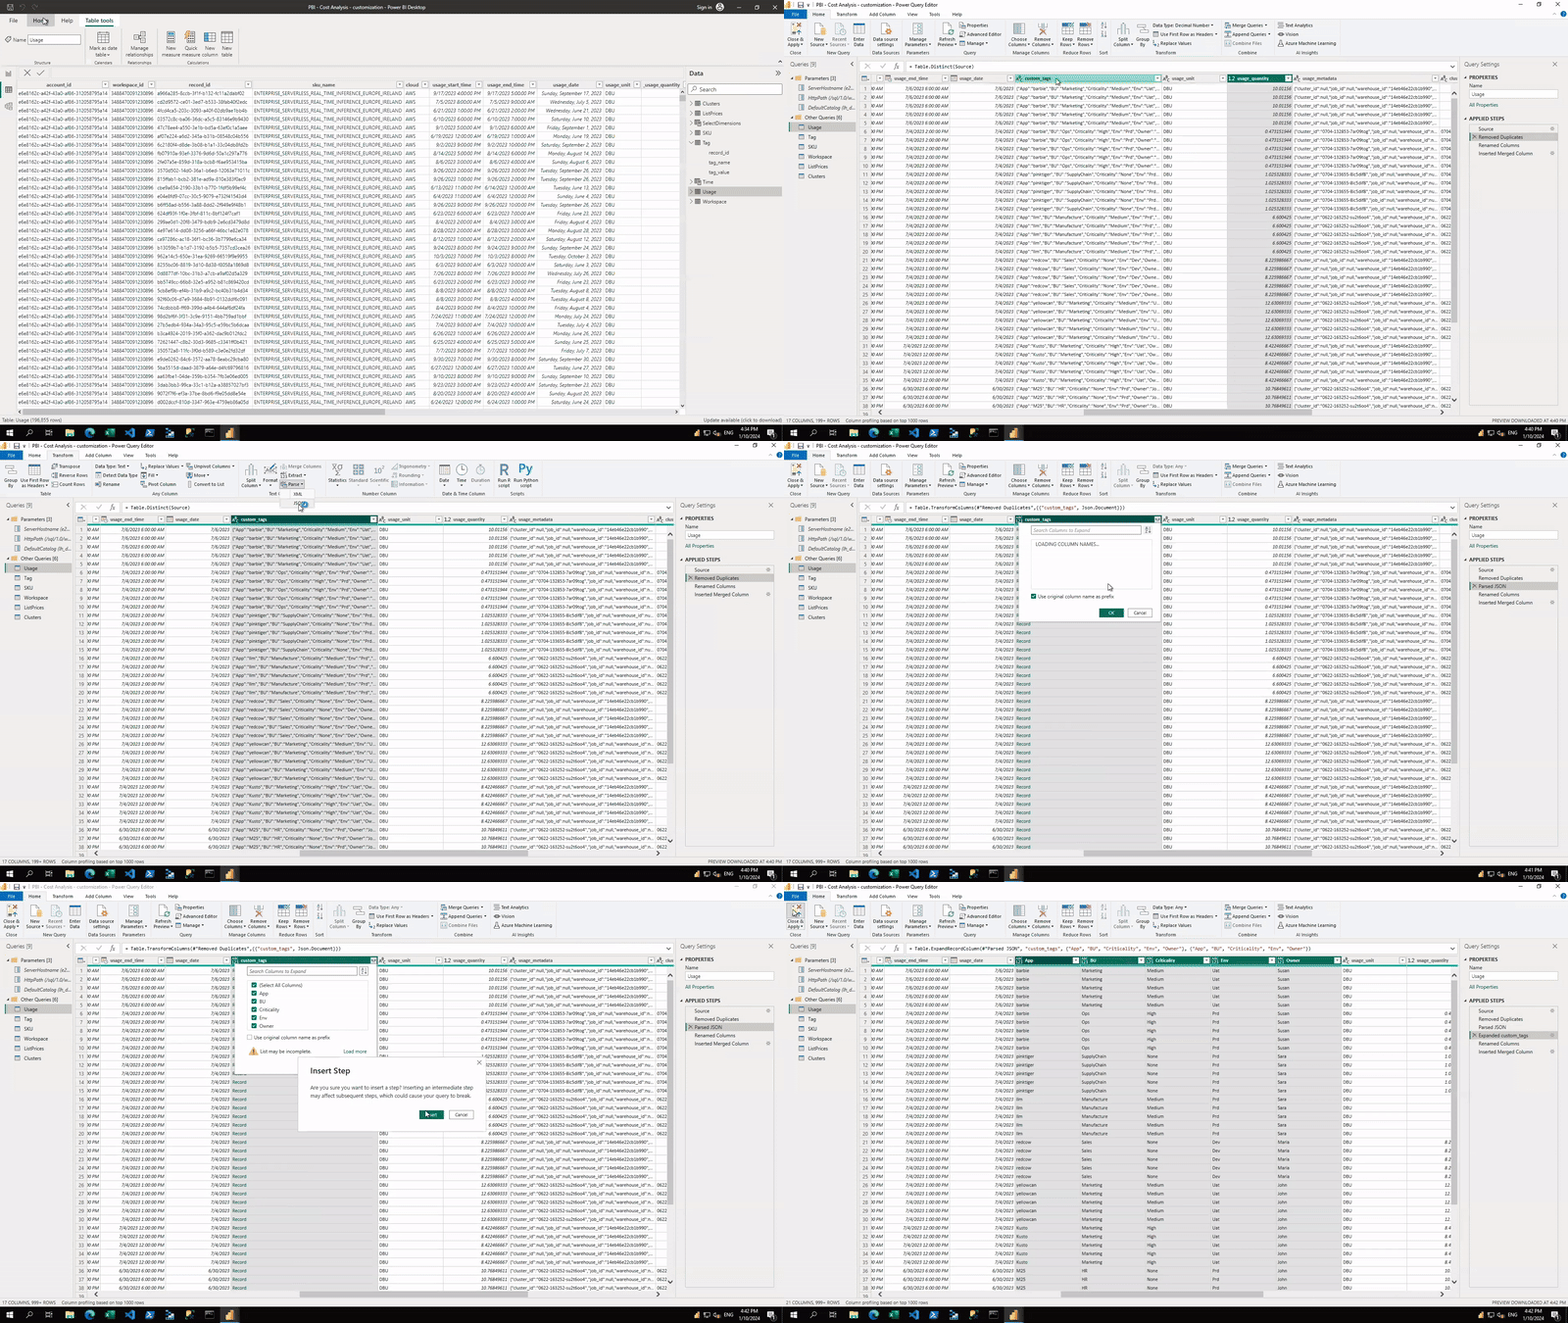
Once the usage table is pivoted, the decomposition tree visual can be amended to facilitate multi-tag root cause analysis as shown below.
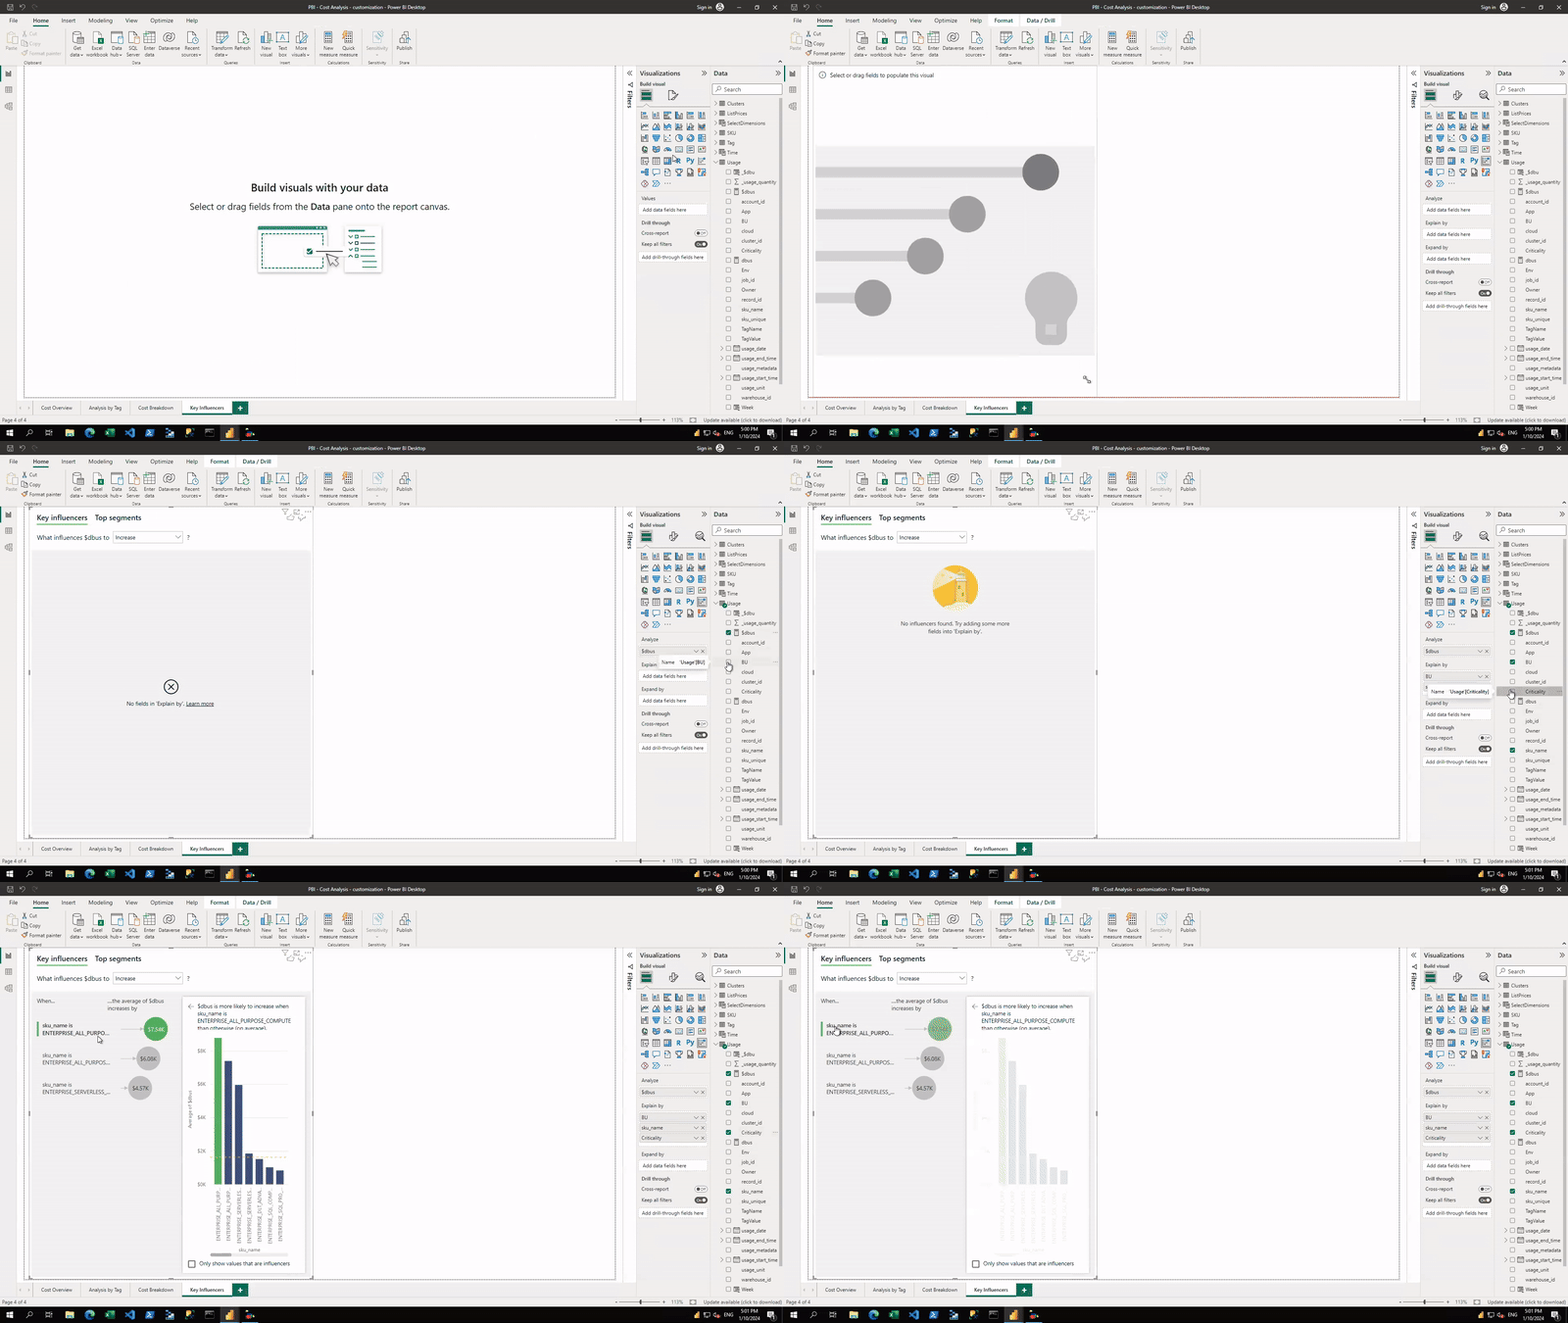
The pivoted usage table can also be used to analyze cost and identify key drivers of spend by using a key influencer visual.
Cosmetics
This template uses a generic theme. If you want to change the theme to match your corporate color scheme, please see the documentation to customize the color theme.
Roadmap
This is the first iteration of this Power BI template, which we are planning to improve and add more functionality over the next few months. For a roadmap of what we’re planning on releasing, please have a look at the list below:
- Expand the list of available KPIs in the semantic model. Add calculations like YTD and MTD DBUs and $DBUs
- Remove the need for any manually imputed reference data, as the system tables evolve
- Capture price changes and reflect those historically
- Allow customers to input their negotiated prices, as opposed to list prices
- Track the progress against any existing commercial agreements


